My roadmap learning experience so far
This is now my second year having to come up with a roadmap for what we call 'release', so while I'm not old hat, I am definitely learning and getting a little better! One of the fun aspects of this is looking at the 'how you go about roadmapping', as in, if you are starting from scratch or not, what are the exercises you can go through to help you develop a plan for the coming year?
We're fortunate enough to have a CTO who pushes things like value proposition design (pain-gain diagrams), and encourages us to really think through what it is we are trying to do - plus takes the time to guide us himself. Last year's roadmap started with a fresh canvas and the question 'if you could only work on one thing, what would it be?'. This was to help focus my scattered brain, and I found it a great starting point. As I am also a visual person, draw.io was used extensively to sketch out my thoughts (also used my whiteboard, but draw.io is portable).
What follows is my roadmap story; the good, the bad, the ugly. Hopefully someone out there can benefit from this shared experience. I'll endeavour leave the specifics of what I'm trying to accomplish out of this - just focus on the process.
TL;DR:
- Roadmapping is an process that forces you to think things through, both high- and low-level
- Pain-gain exercises help you address your problem from a product/customer perspective
- The act of writing out explanations rules out dead-ends and builds your communication skills - you will think through the different criticisms from colleagues ahead of time
- You need metrics (think 'measurable expectations that show your contribution to the organization') from your manager to help prioritize and focus the plan - these underpin everything you do
- A 'plan-do-check-act' approach is critical in properly thinking something through, and to know when to stop when it's no longer effective
Year1 - First unguided attempt
Officially the unofficial release guy, I was asked to lay out a release roadmap for 2017. My metrics/goals were release impact and release cadence - two big things I wanted to improve. The timing was kinda vague, mostly because I was in the stance of 'roadmaps are silly, we should be doing continuous/iterative improvement' (because I viewed roadmapping as a rigid commitment process, not as a clarification and alignment exercise - a good lesson in the power of mental models). A lot of metrics were put down but almost none were used (mostly because the roadmap was quickly forgotten in the rush of daily work).
Long story short - I didn't take it seriously.
While I stuck with the fundamentals for the first two quarters, a lot of the detail pieces were not done, mostly because of time and focus. This is not to say that we didn't accomplish good things - it was just more scattered than it needed to be, and perhaps poorly prioritized. Further, there were a lot of 'good things' (think 'excellence') in the roadmap, but not necessarily things that would alleviate pains AND bring gains.
fig.1 Excel layout of the basic four things I wanted to focus on - Problem/Goal/Result/Success markers
He correctly deduced that I was seeing too much and trying to attack all of it, so he (forced :) ) me to answer a very simple question:
"If you could only work on one single thing right now, what would it be?"
It helps having someone else ask you this, because they prevent you from going off in circles, but the following exercises helped me answer that question.
fig.5 The chart below has each 'thing' as a row. Columns are as follows...
With that done, I launched into the first task. The roadmap/three things was consulted periodically to gauge how I was doing, but for the most part I just got done what needed to.
fig.8 Updated & streamlined Excel overview
I then experimented with alternative ways of visualizing my year. Here I have set themes for each quarter, and tried to layer project steps around continuous tasks.
fig.9 experiment #1
Which led to this generic overview showing continuous tasks alongside initiatives/projects.
fig.10 experiment #2
And then I started this process in an effort to better visualize/break down the '3 things' chart from year1 (fig.7). The goal is to use a plan-do-check-act format, but use the process to iteratively improve the validity of what I'm trying to accomplish...uh...which is a terrible way of saying 'prove to myself this is actually what I want to do'.
So if you were to take the 'Gates' project/initiative from the previous diagram, it would look like this:
fig.12 a pile of project cycles
fig.2 Draw.io version of the above, with some timeline aspects attached and more details
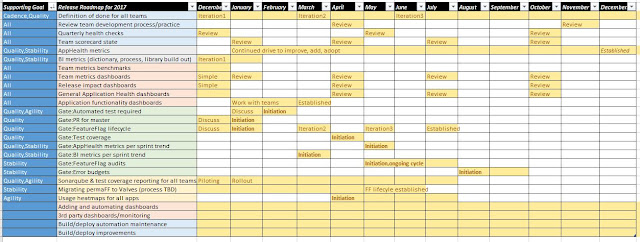
fig.3 Submitted (and updated) 2017 roadmap, timeline format - items in green actually got "done"
Year1.5 - Reset
Our big company offsite happened in early May, and a lot of things came to mind (15-20 pages of notes/ideas), plus a lot of great conversations with folk. One of the outcomes was my CTO saying 'let's work through release priorities together' - which leads us into the iterations following...He correctly deduced that I was seeing too much and trying to attack all of it, so he (forced :) ) me to answer a very simple question:
"If you could only work on one single thing right now, what would it be?"
It helps having someone else ask you this, because they prevent you from going off in circles, but the following exercises helped me answer that question.
The one thing
The advice I got was this: When trying to tackle issues like 'How do I figure out what to do next?', there are two approaches:
- Go deep per roadmap item until no more depth available, then come back up and move to next piece
- Go for breadth - find the low hanging fruit, tackle it, use this to build momentum amongst the teams (i.e. quickly get the ball rolling, and keep it rolling)
So use this advice to build your huge pile of issues/ideas.
- Get all the possible things you could be working on out of your head and onto paper
- Try to think from all different facets of what your job entails, what other people have brought up, what management has brought up, what the goals of your organization are
- Group them, prioritize them, try to think of the big things that are causing disruption, waste, quality-issues
- Narrow this big pile down to 5 root things, enablers/unlockers
If you can't come up with a list of problems like this, socialize your efforts! (or perhaps you are dead and in heaven)
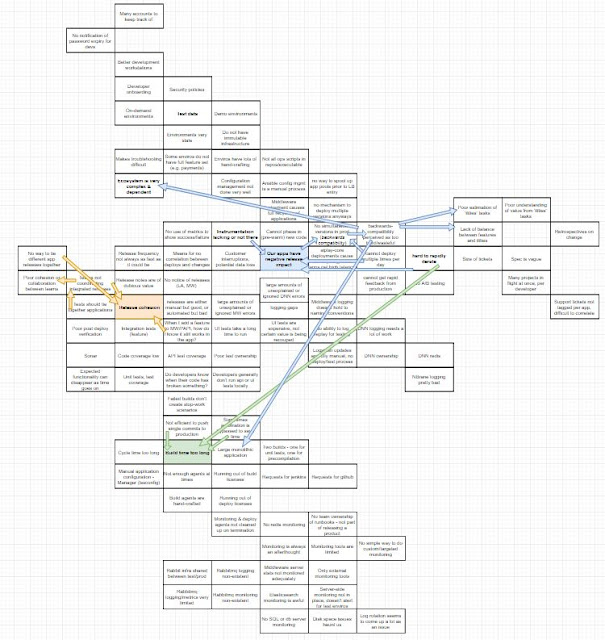
fig.4 My braindump of things, and attempts to tie things together - this on its own was a multi-iteration process
Let metrics drive your choices
Decide with your manager what your metrics are - this is a separate exercise on its own, but generally your manager should have a clear idea of what he needs you to deliver. In my case, my CTO handed mine over, but I was in full agreement anyways (see the original roadmap above). His approach was an upstream perspective - which is where I should have been focusing anyways. e.g. Release impact is a good thing to measure, but it's not a KPI, it's a symptom - you actually care about quality. Poor quality software or process (upstream things) leads to poor release impact (customer = downstream).
- What are the 3-5 key indicators - should be high level, look upstream
- Make sure you are very clear on what they mean - write out the definitions
- Apply your metrics to the 5 things, be objective and honest with yourself
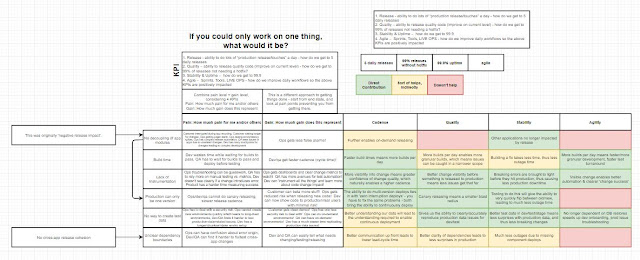
fig.5 The chart below has each 'thing' as a row. Columns are as follows...
- Pain: How much pain for me and/or others
- Gain: How much gain does this represent
- The four metrics, red/yellow/green indicates how much of an impact (if any) this 'thing' would have on the metric
Argue with yourself
Now that you have the first version put together...update the metric fields from colours to colours + explanations.- Each metric field now has text explaining why you chose that colour
- You might have revisited the 5 'things' and added or removed items!
- This is an opportunity to review the metric definitions
fig.6 One thing, v1
Cut the list down
There are only so many hours in a day, and you'll get interrupted - realistically look at what can be cut, or pushed back to next year.- Use the red/yellow/green heatmap to help - more green = more justification
- Compare the above diagram with this one - clear to see which ones needed to be cut!
Once you have this much done, your manager should be on board (or work with you to get things wrapped up), so you can get crackin'!
fig.7 One thing, v2
Communicate and get to work
This obviously differs based on your context, but for me, I needed now to communicate my intentions/plans with the rest of the engineering teams, laying out expectations, goals, what to expect next, etc.With that done, I launched into the first task. The roadmap/three things was consulted periodically to gauge how I was doing, but for the most part I just got done what needed to.
Year1 results
Over the rest of the year I managed to accomplish 1.5 of those 3 items. Obviously a lot more happened, and I probably could have been a bit more focused, but this was a huge improvement over the previous year. The impact of just one of the 3 things was significant - building not only better team morale/confidence (not to mention confidence in engineering by other internal departments), but reducing the symptomatic measurements to almost nothing. Without this roadmapping/refocusing effort, that gain almost certainly would not have happened.Year2 - Trying to improve on the process
So for this year's roadmap, I used some of the same tools, and bodged around with other ideas. My CTO also wanted to see milestones included, so that was added into the mix. You can see that the simple Excel version is a little more organized, has more information, and references the new metrics.fig.8 Updated & streamlined Excel overview
I then experimented with alternative ways of visualizing my year. Here I have set themes for each quarter, and tried to layer project steps around continuous tasks.
fig.9 experiment #1
Which led to this generic overview showing continuous tasks alongside initiatives/projects.
fig.10 experiment #2
And then I started this process in an effort to better visualize/break down the '3 things' chart from year1 (fig.7). The goal is to use a plan-do-check-act format, but use the process to iteratively improve the validity of what I'm trying to accomplish...uh...which is a terrible way of saying 'prove to myself this is actually what I want to do'.
- Consider the scope each of these cycles as a single initiative you're trying to accomplish, each major project/goal would have a number of these cycles (i.e. a number of problems)
- The gist is to try and talk yourself out of (or into) this hypothesis/problem - if you can't clearly build
- If you are having issues coming up with items, it's a sign you are in the weeds
fig.11 looping process to validate problems
So if you were to take the 'Gates' project/initiative from the previous diagram, it would look like this:
fig.12 a pile of project cycles
The final presentable roadmap was a mix of the year's overview (fig.10), the project cycles (fig.12), and detail around the continuous tasks.
So why do all this?
At the end of these exercises, you will have confidence that what you are doing is the right thing. And if you are doing the right thing, you are being effective! Almost as importantly, you will be able to effectively communicate what you are doing and why to the people that need to know.- You get a rough but measurable roadmap for the year (review it every quarter, things change)
- You're now confident in why you're doing things
- You have built out stepping stones to gauge progress which not only makes it easier to start, but gives you a feeling of real accomplishment
- You've begun training your brain to critically think things through, and to use the plan-do-check-act lifecycle as a matter of course
- Being an effective team member has all sorts of benefits


Comments
Post a Comment